The sprint velocity is a mean
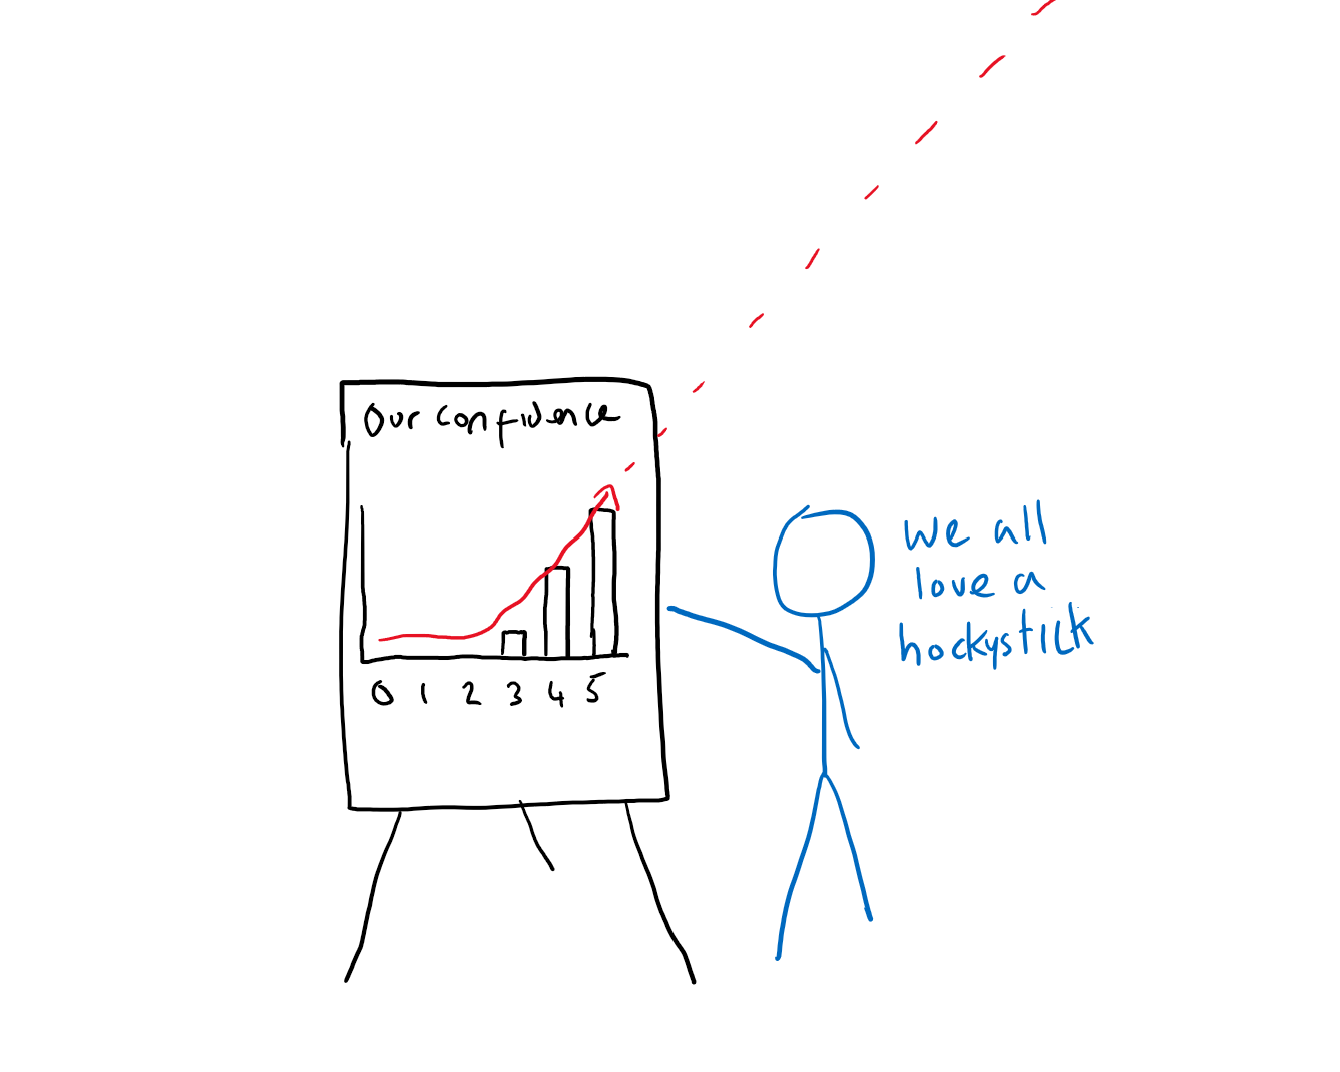
One of my previous teams would give a five-finger confidence rating after each planning session to see how each team member felt the plan. Like most times before, the median was a 4. After all we had brought in the same number of stories as the velocity, all sounds good right?

After playing around with the velocity forecaster something hit me that I hadn’t really considered before, even though I knew that we use the average of the last couple of iterations as our velocity. By the definition of it being a mean (assuming the central limit theorem holds true) we should hit that 50% of the time.
To think about that in some more context let’s take some of the previous points delivered on a project:
36, 63, 21, 93, 63, 63, 77, 63, 22, 65, 31
The average would be 54.3 (90% CI: 41.6-66.9). And out of this sample 63% are above the average which seems ordinary for a small sample. This means the mean is holding relatively true, to test this more concretely we would need at least 30 data paints.
This post is pointing out quite an obvious fact in hindsight, just something I hadn’t considered. As in some planning sessions the sprint velocity and the goals based of them are often discussed as sure bets, something we can be confident showing the client, in reality it’s a coin toss.